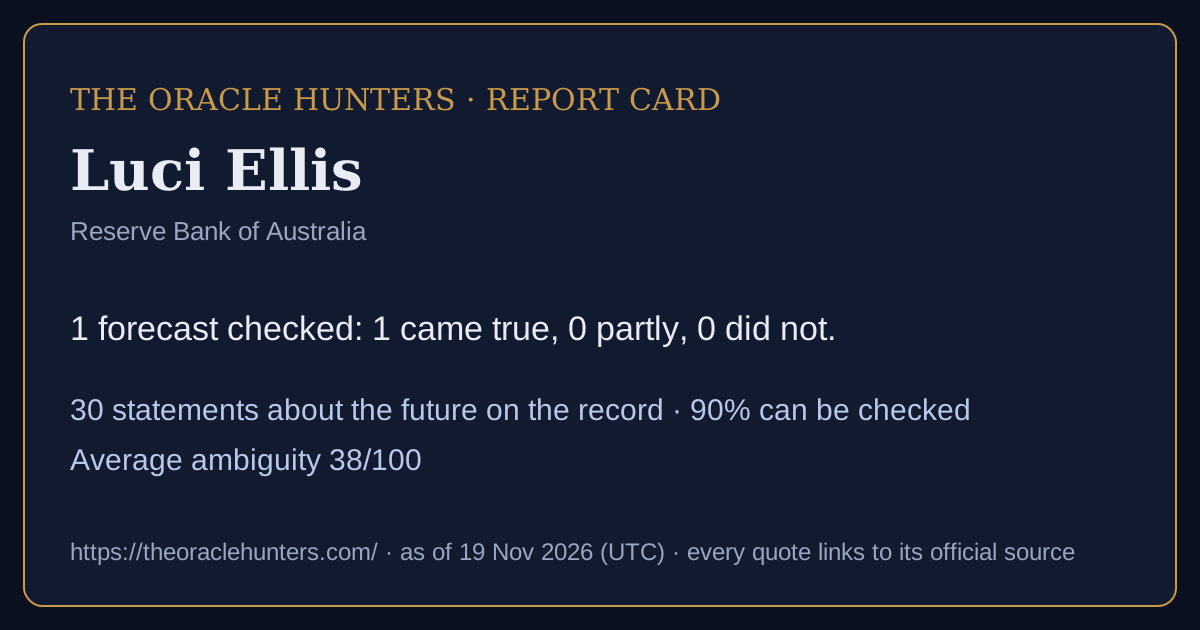
Luci Ellis
Reserve Bank of Australia
Track record: 1 forecast checked: 1 came true, 0 partly, 0 did not.
30forecasts & commitments on the record
90%can be checked as stated
38average ambiguity (0-100)
0goalpost moves recorded
0confirmed U-turns
Timeline
came true partly did not not due / being checked / too vague
Calibration score: shown after 10 checked forecasts with a stated likelihood (now 1).
How they speak about the future: educated guess 13, based on data 11, stated on authority 6.
Kinds of claim: forecast 14, scenario (if… then) 11, mixed claim 3, commitment 2. · Download this report card as a picture
In the nine words
πρόγνωσιςInference from evidence11 · 37%πρόνοιαPreparing for the future11 · 37%μαντείαInspired knowledge4 · 13%εἰκασίαConjecture2 · 7%προαναγγελίαPublic pre-announcement2 · 7%
How to read this
Each box is one sentence a public figure or institution said about the future, word for word, with a link to the official text. Can be checked means it names what will happen, by when, and how likely - so it can be compared with official figures later. Too vague to check means it does not. Ambiguity (0-100) is how many different ways the sentence can be read. When the date passes, the forecast is compared with official data and marked came true, partly or did not come true. Labels judge the sentence, never the person. Full guide and glossary.Checked
In this baseline scenario, we expect the unemployment rate to continue to increase over the rest of this year (Graph 5;
Came true. Said: unemployment would rise in 2020. Official figures for Australia: 5.1% in 2019, 6.4% in 2020 (World Bank open data). official data · checked 14 Nov 2026 · automatic check against official data (rules v3)
On the record (30)
But beyond the next year, inflation expectations remain well anchored inside the target range, both here and overseas (Graph 1).
Its effects are hard to disentangle: expansionary fiscal policy boosts demand in the short run, but might reduce expected future growth in the long run if people focus on the need to fund current fiscal spending.
Overall population growth is now expected to revert to close to pre-pandemic patterns by 2024.
Beyond the next quarter or so, we expect inflation to be low (Graph 8;
We project that education exports will remain broadly stable over the next year.
This increase in labour force participation is expected to outpace any recovery in employment outside Victoria in the second half of this year.
In this baseline scenario, we expect the unemployment rate to continue to increase over the rest of this year (Graph 5;
Came true. Said: unemployment would rise in 2020. Official figures for Australia: 5.1% in 2019, 6.4% in 2020 (World Bank open data). official data · checked 14 Nov 2026 · automatic check against official data (rules v3)
We expect that employment and total hours worked will decline over the next few months, partly because of the increased activity restrictions in Victoria.
Taking 2020 as a whole, global GDP is expected to contract by more than 4 per cent, before rising by nearly 6 per cent in 2021.
So it might have been thought a little surprising that public sector wages growth actually picked up noticeably in the June quarter of this year.
A firm might decide to offer higher wages if they can't find a suitable candidate at the current wage.
And if you wanted to lower unemployment, there was a limit to how far you could go without creating 'surprise' inflation.
The Board is seeking to set monetary policy so that inflation averages between 2 and 3 per cent over the medium term.
For example, the earlier period of strong housing price growth will only increase capital gains tax revenue if the asset was owned during that period.
The unemployment rate declined by ½ percentage point over 2018, reaching the level of 5 per cent before our forecasts implied it would (Graph 1).
A useful rule of thumb is that, in the absence of adjustments to tax brackets to allow for bracket creep, for every one percentage point of growth in household income, taxes paid by households will on average increase by about 1.4 percentage points.
It is still well below what one might expect in the longer run, if inflation is to average between 2 and 3 per cent and if productivity maintains a similar average growth rate to its average over the past decade or so.
It could be that, after a period of realisation and learning, we will see wages growth pick up more emphatically in these areas.
These are often hard to quantify even after the fact, but some examples might include: new export businesses enabled by the construction or expansion of an airport; higher productivity of logistics firms if their vehicles spend less time in traffic; and better health outcomes from reduced accident rates when roads are made safer.
But there's a real question of how long that could continue if income growth stays weak.
## How Resilient Will Consumption Growth Be If Income Growth Stays Weak?
- How resilient will consumption growth be if income growth stays weak?
If wage growth is to pick up, wage increases for other workers - including in future enterprise agreements or in other wage-setting streams - will need to pick up.
We still expect growth to pick up to around 3¼ per cent over 2018 and 2019.
Resource exports now account for around half of Australia's export revenue, and that will remain broadly true even if commodity prices fall a bit from here.
This sector is not where we will find an 'engine of growth' to pull us all along.
We anticipate that resource exports will add about a cumulative 1.2 percentage points to GDP over the next two years.
If this scenario happens, and inflation stays low despite reasonable growth in a range of economies, policymakers will face a challenge.
If productivity growth is indeed cyclical, it will start to pick up over time in these economies.
It is common to assume that if wages are lifted by the powers of the state, rather than by the forces of supply and demand, employment of the affected group will fall.
Also said - not checkable as stated (12 newest)
Remarks about the future with no date, figure or likelihood that could be checked. They are kept on the record and shown here, but not scored.
People look though the expected inflation component of nominal rates; lenders expect to be compensated for it, and borrowers expect to have to provide that compensation.
That said, if fiscal policy is persistently tight, it is likely that monetary policy will have to be persistently accommodative to offset the contractionary influence on the economy.
Something must have been offsetting this apparently expansionary policy; fiscal consolidation in the wake of the GFC, especially in Europe, could have been part of that.
For example, those who look forward to a future of faster productivity growth must recognise that this will likely imply higher real rates as well as higher trend growth.
It should be noted that the desire for more space has likely been more widespread than the ability and willingness to trade-off place.
In considering the effects of the pandemic on the housing market, we need to remember that only some of these shifts might last.
This is a necessarily rough calculation and, as I mentioned, we will know more when the Census results are released.
And I'm not going to say much about the prices of established homes.
Rather, I plan to focus on some of the underlying drivers of housing demand, their likely persistence, and the capacity of the construction industry to meet that demand.
At the same time, we need to be mindful that some of the shifts going on could in part be temporary.
There will be at least some cases of people moving further out from the city centre, because long commutes will not seem so unpleasant if you only need to do it a couple of days a week.
But it is reasonable to expect that these disruptions will ease over time, as bottlenecks are dealt with and health-related constraints on production ease.