Citigroup
Institution - official statements with no named speaker · USA
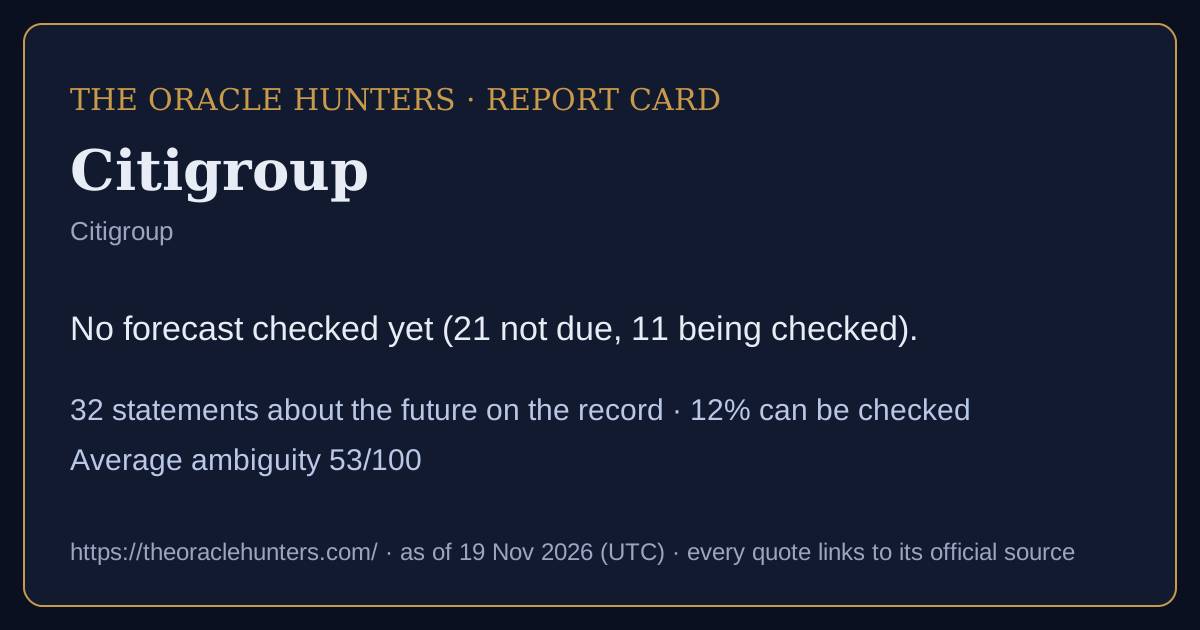
Track record: No forecast checked yet (21 not due, 11 being checked).
32forecasts & commitments on the record
12%can be checked as stated
53average ambiguity (0-100)
0goalpost moves recorded
0confirmed U-turns
Timeline
came true partly did not not due / being checked / too vague
Calibration score: shown after 10 checked forecasts with a stated likelihood (now 0).
How they speak about the future: based on data 27, stated on authority 5.
Kinds of claim: forecast 26, mixed claim 4, commitment 2. · Download this report card as a picture
In the nine words
πρόγνωσιςInference from evidence25 · 78%μαντείαInspired knowledge5 · 16%χρησμοδοσίαInstitutional delivery2 · 6%
How to read this
Each box is one sentence a public figure or institution said about the future, word for word, with a link to the official text. Can be checked means it names what will happen, by when, and how likely - so it can be compared with official figures later. Too vague to check means it does not. Ambiguity (0-100) is how many different ways the sentence can be read. When the date passes, the forecast is compared with official data and marked came true, partly or did not come true. Labels judge the sentence, never the person. Full guide and glossary.On the record (32)
Markets provision for credit losses was a benefit of $15 million, reflecting a net ACL release of $12 million, driven by refinements to loss assumptions, primarily offset by increased uncertainty in the macroeconomic outlook, and $3 million of net credit recoveries.
The provision in the prior-year period was $51 million, reflecting a net ACL build of $45 million, driven by increased uncertainty in the macroeconomic outlook and transfer risk, and $6 million of net credit losses.
Services provision for credit losses was $94 million, reflecting a net ACL build of $91 million, driven by increased uncertainty in the macroeconomic outlook and changes in credit quality on certain exposures, partially offset by refinements to loss assumptions, and $3 million of net credit losses.
The provision in the prior-year period was $2.7 billion, reflecting $2.5 billion of net credit losses and a net ACL build of $264 million, driven by increased uncertainty in the macroeconomic outlook and portfolio quality, largely offset by lower net lending activity.
Citigroup provision for credit losses was $2.8 billion, reflecting $2.2 billion of net credit losses and a net allowance for credit losses (ACL) build of $597 million, driven by portfolio quality, including seasonal mix changes, as well as increased uncertainty in the macroeconomic outlook, partially offset by refinements to loss assumptions and lower net lending activity.
I’m excited for next month’s Investor Day where we’ll discuss our path forward and how we will realize the significant upside Citi offers,” Ms. Fraser concluded.
The provision in the prior-year period was $397 million, driven by $257 million of net credit losses and a net ACL build of $140 million, driven by higher consumer volume, changes in the macroeconomic outlook and changes in credit quality in Mexico Consumer.
USPB provision for credit losses was $1.7 billion, driven by $1.8 billion of net credit losses and a net ACL release of $110 million, driven by improvements in portfolio quality, including seasonal mix changes, primarily offset by higher volume and changes in the macroeconomic outlook.
The provision in the prior-year period was a benefit of $240 million, driven by a net ACL release of $247 million, primarily driven by changes in the macroeconomic outlook, changes in credit quality and transfer risk, and $7 million of net credit losses.
The provision in the prior-year period was $134 million, driven by a net ACL build of $134 million, driven by changes in credit quality, partially offset by changes in the macroeconomic outlook.
The provision in the prior-year period was $2.6 billion, driven by $2.2 billion of net credit losses and a net ACL build of $351 million, driven by higher net lending activity, partially offset by changes in the macroeconomic outlook.
All Other (managed basis) cost of credit was $331 million, reflecting $297 million of net credit losses and a net ACL build of $34 million driven by higher consumer lending volume and changes in portfolio composition in Mexico, largely offset by changes in the macroeconomic outlook.
USPB cost of credit was $1.8 billion, reflecting $1.8 billion of net credit losses and a net ACL build of $66 million, driven by changes in portfolio composition and higher volume, largely offset by changes in the macroeconomic outlook.
Citigroup cost of credit was $2.5 billion, reflecting $2.2 billion of net credit losses and a net allowance for credit losses (ACL) build of $236 million driven by higher volume, changes in portfolio composition and transfer risk associated with client activity in Russia, partially offset by changes in the macroeconomic outlook.
“As I’ve said, next year’s 10-11% ROTCE target is a waypoint, not a destination.
All Other (managed basis) cost of credit was $359 million, compared to $186 million in the prior-year period, driven by a net ACL build related to deterioration in the macroeconomic outlook in the current quarter, and higher net credit losses in the consumer loan portfolio in Mexico.
Wealth cost of credit was $98 million, compared to a benefit of $(170) million in the prior-year period, driven by a net ACL build related to deterioration in the macroeconomic outlook in the current quarter, compared to an ACL release in the prior-year period, and higher net credit losses.
Banking cost of credit was $214 million, compared to a benefit of $(129) million in the prior-year period, driven by a net ACL build related to deterioration in the macroeconomic outlook in the current quarter, compared to an ACL release in the prior-year period, partially offset by lower net credit losses.
Citigroup cost of credit of $2.7 billion increased 15%, driven by a higher net build in the allowance for credit losses (ACL) related to deterioration in the macroeconomic outlook in the current quarter relative to the prior-year period, and higher net credit losses in the card portfolios in USPB.
While we now expect our 2026 RoTCE to be between 10% and 11% in order to make additional investments in our businesses and Transformation, this level is a waypoint, not a destination.
We returned a total of $2 billion in capital to our shareholders through common dividends and share buybacks and we will continue to review our level of capital return on a quarter-to-quarter basis,” Ms. Fraser concluded.
While it is not an ideal environment for wealth management, the drivers of this business continue to be very positive, and we announced that Andy Sieg will be joining us as its CEO later this year.
For additional information, see “Capital Resources—Regulatory Capital Treatment—Modified Transition of the current expected” in Citigroup’s Annual Report on Form 10-K for the year ended December 31, 2021, and Citigroup's Current Report on Form 8-K dated May 10, 2022 (as amended by Current Report on Form 8-K/A dated May 10, 2022).
As part of the previously announced intent of Citi to reduce its operations in and exposure to Russia, Citi is now informing its multinational clients in Russia that it will be ending nearly all of the institutional banking services it offers in Russia by the end of the first quarter of 2023.
“We continue to shrink our operations in and exposure to Russia and we will be ending nearly all of the institutional banking services we offer next quarter.
“Consistent with the commitment we made in 2017, we remain on track to return more than $60 billion of capital to our shareholders over a three-year period which ends next year.
“Finally, we were pleased to receive a non-objection from the Federal Reserve to our capital plan submitted as part of the 2018 CCAR cycle which will allow us to return $22 billion in capital to common shareholders over the next year, marking another significant step towards delivering on our commitment to return at least $60 billion in capital over a …
Tax reform does not change our capital return goals as we remain committed to returning at least $60 billion of capital in the current and next two CCAR cycles, subject to regulatory approval.
This utilization fuels our ability to generate regulatory capital and, with the Fed’s non-objection to our capital plan, I am pleased that we will significantly increase the amount of capital returned to our shareholders over the next year.”
As of the end of the first quarter 2016, Citigroup had signed agreements to reduce Citi Holdings assets by an additional $10 billion, the significant majority of which are expected to be completed during the remainder of 2016.
Given that Holdings now accounts for such a small percentage of Citi’s balance sheet, we will no longer report its results separately after this year.
As of year-end 2015, Citigroup had signed agreements to reduce Citi Holdings assets by an additional $7 billion, substantially all of which are expected to be completed during 2016.